The goal of this project was to be able to form a spatial query and use the
skills and tools we have learned in class to be able to find an answer to that query. It is to better our
understanding of real life examples of using these tools and program, and it more like work done in
the field by people who work with GIS.
Methods:
For this section I
first started by tracking down all the data I needed to answer my spatial
question. I found data from geodatabases that already existed that I could find
in ArcCatalog. I then had to find downloadable data through other means because
most that I needed wasn’t already there. I used the website USGS to find land
cover data and … to find the data I needed for precipitation and temperature.
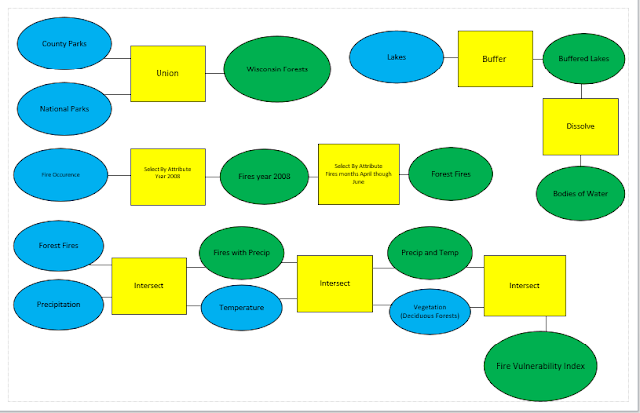
After I got all of my data I then could start working on answering the
question. I started by adding the county and national forests feature classes
that I got from the Wisconsin DNR together by using union. I then used buffer
for the lakes feature class to find the area 10 miles within a lake. After the
buffer was complete I used the dissolve tool to confine the buffered area. To
narrow down the amount of past forest fires I used I picked fires that occurred
from April to June because those were the months with the highest density of
fires. I also narrowed it down by using fires from the most current year from
the data which was 2008. I used select by attributes from the fire occurrence
feature class to select both the months and the year, and then intersected the
two to form a new fire feature class that pertained to answer the question and
named it Forest Fires. Then, I used the land cover data I obtained from USGS
and used select by attributes to select deciduous forests from the value field
of the attribute table. I then made that a new feature class and intersected
that with the forest fire feature class I had just made and named it Wisconsin
Deciduous forests. By narrowing down all the information I needed I could then
start to add it all together to form a fire vulnerability index map to tell the
areas most susceptible to fires in Oconto County. I intersected the fires with
precipitation, then the result of that with temperature and the result of that
with the the Wisconsin Deciduous Forests. I was then finished using all the
tools I needed, and created a cartographically pleasing map with two different
feature classes one showing the whole state of Wisconsin featuring
precipitation and temperature and one of Oconto County showing the rest of the
feature classes with the spots of the fires that have occurred before within
the structure of my spatial query. I also added a legend and wrote about the data
sources on my final map.
 |
| Figure 1: Data Flow Model |
This section
includes the final map of my answer to the spatial query. The area light tan
area that has a small amount of rainfall and a semi-warmer temperature than
other parts of the state that contain forests, and the green land where
deciduous forests are, is the are that is most vulnerable to forest fires. This
is backed up by the fact that the past fires that have occurred are all in that
area of the county. The area of higher precipitation had no fires and it also
didn’t have the forests and lakes within 10 miles of it.
 |
| Figure 2: Final Map |
Sources:
Wisconsin DNR, 2008