Lab 5: Vector Geo-processing
Methods: I first unzipped the data from the Michigan Department of Natural Resources provided to us on D2L.
Part 1: In ArcCatolog for task one, I then created a feature class from the XY table by right clicking on the bear_locations_geog$ excel sheet and named in bear locations. From ArcMap I added all the bear management feature classes to a blank map, and also added the new feature class bear locations I made previously. After adding the feature class land-cover I changed the symbology to unique value of "minor type" to a multi-color scale. Then to find out what land cover type the bears were located in when their position was recorded with GPS by performing intersection to create a new feature class which has the ID number of the bear and the land cover type named bear_cover. Another second spatial operation was also necessary to find out how many bears were found in each habit type. Then to answer the questions in Objective 3, I used select by location to find the bears within 500 meters of a stream. For Objective 4 which was to find suitable land for bears in Marquette County, I used buffer for 500 metes within a stream, and then used select by attribute to select Mixed Forest Land, Forested Wetlands, and Evergreen Forest Land from the feature class landcover. I then intersected the two, to find the area that they both had in common and then dissolved the results to make the lines within the new feature class go away. For Objective 5, we were asked to find the suitable land for bears which is also within the DNR management lands of Michigan. I did this by intersecting the results form Objective 4 for suitable bear habitat with the feature class dnr_mgmt, and then using the dissolve tool to eliminate internal boundaries. Objective 6 asked to use the area in Objective 5, but make it so that it is not within 5 kilometers of any Urban or Built up lands. I did this in three steps by first using select by attributes to to select Urban or Built up lands in the landcover feature class to make it it's own feature class. I then used buffer to find the area within 5 kilometers of Urban lands, and then I used the erase tool to remove that unwanted area, so what only remains is outside of that 5 km radius. Then I created a cartographically pleasing map of the county and study area, and made a data flow model for the steps I used as well.
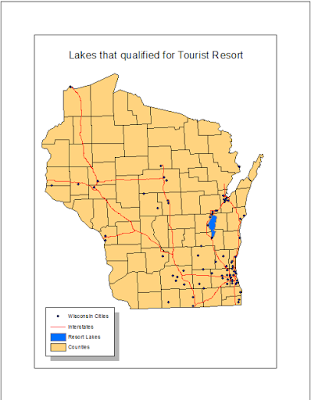
Part 2: The objective to part two is to find areas in Wisconsin that have high potential for a suitable resort, that is around a 5 square mile lake and is not more than 10 miles from a city using python codes. In section one of part two, to find the desired area for this part I first started a python code that used a buffer to for 10 miles around all cities but not any further and named it "WI_Cities_Buff_AT". After that python, I did a select by attribute python that would get lakes greater than 5 square miles in area and named it Lakes_5_area. Then, I used Clip to to find the area that included both WI_Cities_Buff_AT and Lakes_5_area and named it Lakes_resortT_AT, and created a cartographically pleasing map to show the selected area to section 1. I then created a model flow diagram of my steps for this section.
For Section two the scenario was to find potential impact zones for nitrous oxide and other air pollutants from automobiles plying the various interstates in Wisconsin. I did this by using a python code and doing a Multiple Ring Buffer. I did the buffer of 1-6 miles of the Wisconsin Interstates. That was all that was needed of python scripts, so I then created a cartographically pleasing map categorized the miles with the level of hazard from 1 mile away being very high, 2 being high, and all the way down to 6 miles being low risk of hazard. Lastly I created a data flow model of my steps for this section.
Results:This section I will be showing the maps and python scripts demonstrating the
methods I used and the results I got from the objectives. It includes finished maps, data flow models, and python script codes.
 |
| Figure 1: Map of the result of Part 1 |
 |
| Figure 2: Data Flow model of Part 1 |
 |
| Figure 3: Python Scripts of Section 1 from Part 2 |
 |
| Figure 4: Map of the results of Section 1 from Part 2 |
 |
| Figure 5: Data Flow Model of Section 1 from Part 2 |
 |
| Figure 6: Python Script from Section 2 of Part 2 |
 |
| Figure 7: Map result of Section 2 from Part 2 |
 |
| Figure 8: Data Flow Model from Section 2 of Part 2 |
Michigan Department of Natural Resources (DNR)
ESRI
Price, Maribeth.2016. Mastering ArcGIS. 7th Edition data. McGraw Hill.
Wilson, Cyril 2012, A comprehensive Lake featres for Wisconsin

No comments:
Post a Comment